
Semi-Scientific Recession Indicators
Here’s a fun and insightful area of economics! While traditional, “scientific” indicators are things like the Inverted Yield Curve, Nonfarm Payroll Employment, and Real GDP (more on that boring stuff later in the article), there is a fascinating list of “semi-scientific” or unconventional recession/financial indicators that track consumer behavior and sentiment in surprising ways.
These indicators are often referred to as “quirky,” “bizarre,” or “soft” data points. They are not used by central banks for policy decisions but have historically shown a correlation with economic downturns by reflecting changes in discretionary spending, confidence, and stress.
Here is a list of some of the most well-known semi-scientific recession indicators:
💄 The “Affordable Luxury” Indexes (Small Indulgences)
These track the idea that when people can’t afford big luxuries (like a new car or vacation), they turn to cheaper treats to boost their spirits.
- The Lipstick Index: An increase in the sales of relatively inexpensive cosmetics, such as lipstick, suggests that consumers are cutting back on high-end discretionary spending but still seeking small indulgences. (Note: This indicator was notably reversed during the COVID-19 pandemic due to mask-wearing, with nail polish sales sometimes taking its place.)
- Hair Dye Sales: An increase in the sales of boxed, at-home hair dye (and a corresponding drop in salon visits) suggests people are pinching pennies on beauty and grooming services.
- Mini Liquor Bottles Index: A rise in the sales of mini-bottles or single-serving alcoholic drinks. The theory is that people are substituting large, more expensive purchases with smaller, cheaper alternatives.
- Appetizer Index: A reported rise in appetizer orders at restaurants, sometimes coupled with a drop in dessert orders. The theory is that diners are trying to fill up on cheaper options to avoid the cost of a full entrée.
👖 The “Under the Radar” Consumption Indicators
These look at items that are not visible to the outside world, revealing true financial anxiety.
- The Men’s Underwear Index: A decline in the sales of men’s underwear, popularized by former Federal Reserve Chair Alan Greenspan. The logic is that men put off buying new underwear in hard times because it’s not a visible item and can be worn longer.
- Diaper Rash Ointment Sales: An increase in the sale of diaper rash creams. This grim theory suggests that when money is tight, some parents stretch diaper usage to save money, leading to more rashes.
📦 The “Business Activity” and Spending Shift Indicators
These look at changes in supply chain and big-ticket or long-term spending.
- The Cardboard Box Indicator: A decrease in the production and sale of corrugated cardboard boxes. Since nearly all manufactured goods are shipped in a cardboard box, a drop in box orders is a leading indicator that businesses are preparing for fewer sales and a slowdown in demand.
- RV and Boat Sales: A significant decline in the sales of large, big-ticket recreational items (RVs, boats, ATVs). These are highly sensitive to consumer confidence and are often the first major purchases to be postponed in an uncertain economy.
- DIY and Repair Store Sales: An increase in sales at hardware and home improvement stores (like Lowe’s or Home Depot), often for repair parts and supplies. The idea is that people are “fixing what they have” instead of buying new appliances, cars, or homes.
👗 The “Cultural & Social” Indicators
These attempt to link broad cultural trends to the economic mood.
- The Hemline Index: The theory, dating back to the 1920s, that hemlines on women’s skirts and dresses get shorter when times are good (reflecting optimism and confidence) and longer during economic downturns (reflecting conservatism and caution).
- The Stripper Index (or “Exotic Dancer Index”): A reported drop in tips at exotic dance clubs. This tracks a decline in highly discretionary, cash-based spending, which is often one of the first things to go when wallets get squeezed.
🔍 The “Digital Sentiment” Indicator
- Google Search Trends: A spike in searches for terms like “coupons,” “cheap groceries,” “how to budget,” or “unemployment benefits.” This reflects real-time, widespread anxiety and behavioral shifts as people look for ways to save money.
While these indicators are often mentioned in financial media, it’s important to remember they are anecdotal and lack the rigorous statistical backing of official economic data. They are best used as interesting supplements to the core, validated economic indicators.
The “official” recession and financial indicators are the ones used by economists, the Federal Reserve (Fed), and the National Bureau of Economic Research (NBER)—the body that officially dates US recessions.
These indicators are typically categorized as Leading, Coincident, and Lagging, depending on whether they change before, during, or after a recession.
Here is a list of the most crucial, academically-backed indicators:
🏛️ The Core “Scientific” Recession Indicators
I. Leading Indicators (Predictive)
These are signals that historically change before the general economy does, offering an early warning.
| Indicator | Economic Principle | Recession Signal |
| 1. Inverted Yield Curve | Financial markets expect lower future interest rates, which happens when the Fed cuts rates to combat a slowdown. This is the most historically reliable predictor. | The yield on short-term bonds (e.g., 2-year Treasury) rises above the yield on long-term bonds (e.g., 10-year Treasury). |
| 2. The Conference Board Leading Economic Index (LEI) | A composite score that combines 10 separate indicators to smooth out volatility and provide a single, broad forecast. | A persistent, significant decline (e.g., a drop of $4\%$ or more over a six-month period) in the overall index. |
| 3. Initial Jobless Claims | Measures the number of people filing for unemployment benefits for the first time. Employers cut back hours and then lay off workers before a downturn is officially declared. | A sustained increase in weekly claims, indicating rising layoffs and a weakening labor market. |
| 4. Manufacturing/Factory Orders | Tracks the number of new orders placed by businesses for durable and non-durable goods, often reported by the Institute for Supply Management (ISM). | A sustained decline in new orders, signaling that companies anticipate lower future consumer and business demand. |
| 5. Building Permits | Measures the number of new housing units authorized for construction. Housing is highly sensitive to interest rates and consumer confidence. | A sustained drop in permits, showing developers and investors are worried about future demand. |
| 6. Consumer Expectations | Gauges consumer confidence about future business and job conditions (e.g., University of Michigan or Conference Board surveys). | A sharp decline in consumer expectations, which often precedes a drop in discretionary spending. |
II. Coincident Indicators (Real-Time)
These are signals that change at the same time as the broader economy, helping the NBER confirm a recession is already underway.
| Indicator | Economic Principle | Recession Signal |
| 1. Nonfarm Payroll Employment | The total number of paid U.S. workers, excluding farm, government, and non-profit employees. (The most important coincident indicator.) | Sustained month-over-month declines in job creation or outright job losses. |
| 2. Industrial Production | Measures the real output of factories, mines, and utilities. It tracks actual goods being produced. | A persistent decline in the index, reflecting manufacturers cutting output due to reduced demand. |
| 3. Real Personal Income (Excluding Transfer Receipts) | Measures the income people earn from wages, business, and investments (adjusted for inflation and excluding government payments). | Sustained decline in real, inflation-adjusted income. |
| 4. Real Manufacturing & Trade Sales | Measures total sales across manufacturing, wholesale, and retail (adjusted for inflation). | Sustained decline in real sales, showing consumers and businesses are spending less. |
III. Lagging Indicators (Confirmatory)
These indicators change after a recession has already begun, confirming that the economic trend has taken hold.
| Indicator | Economic Principle | Recession Signal |
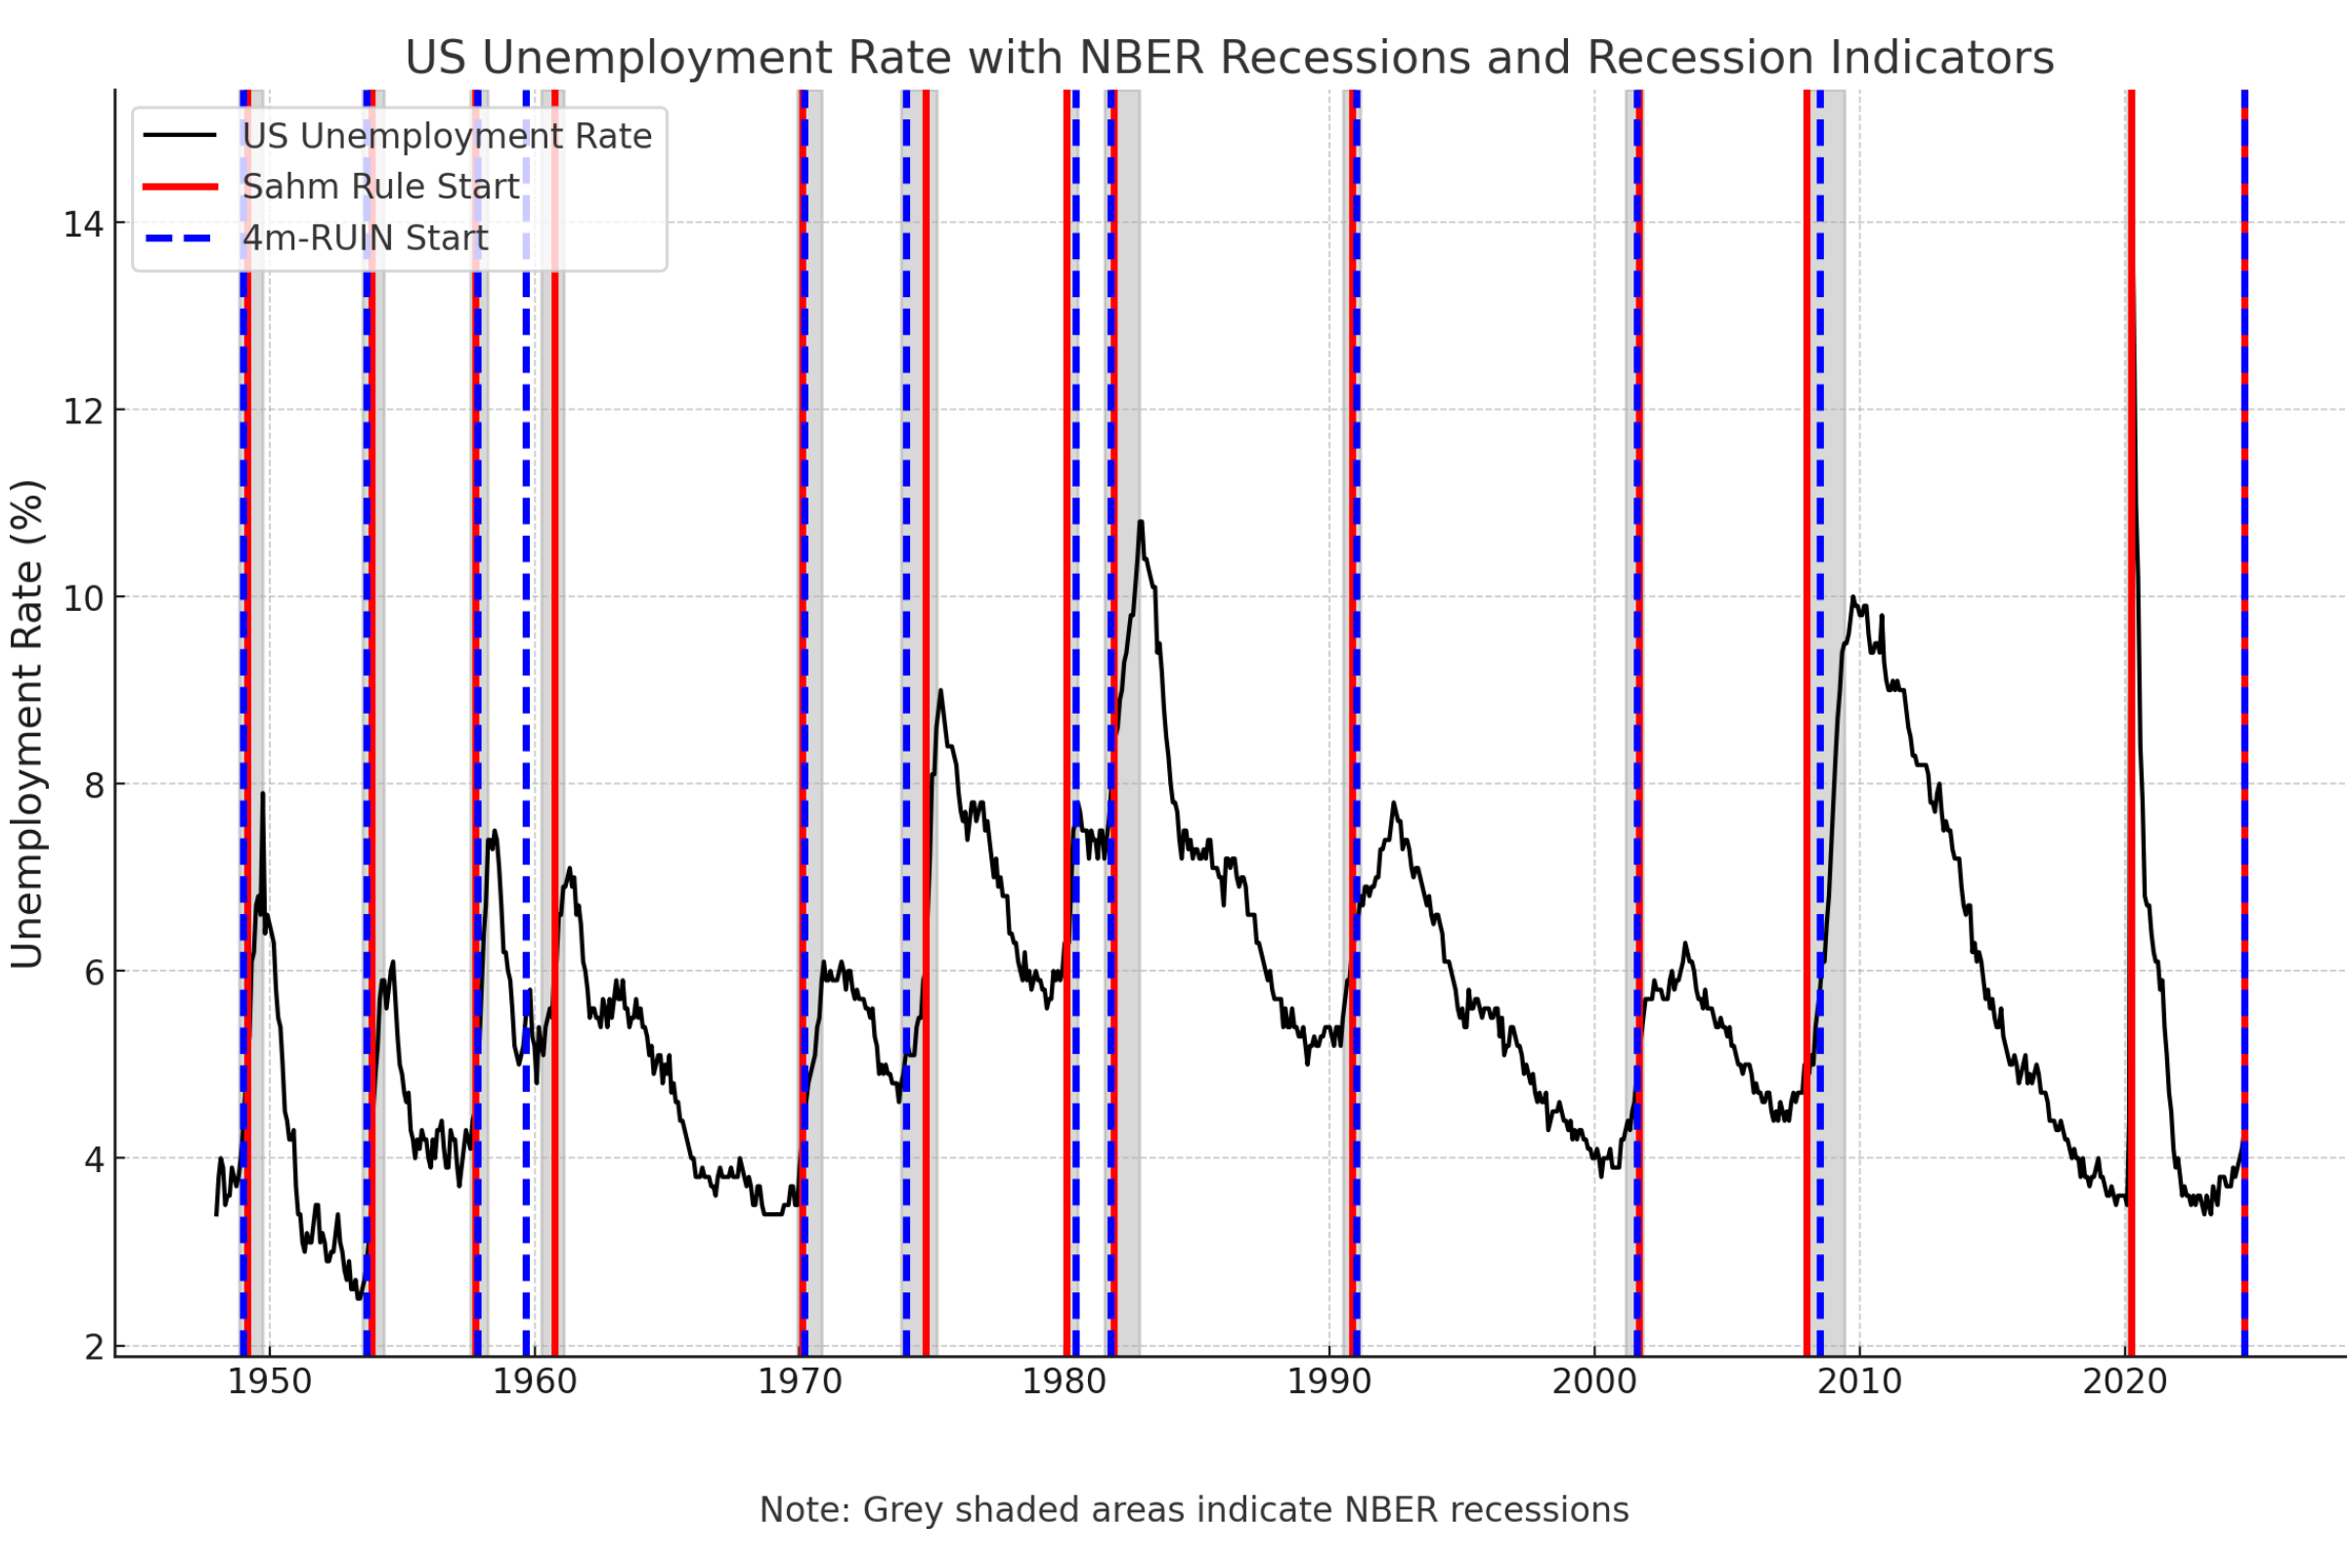
| 1. Unemployment Rate | The percentage of the labor force that is jobless. Businesses only start laying people off after a slowdown is confirmed. | A sustained rise in the official unemployment rate (U-3). (Often confirmed by the Sahm Rule, where the 3-month average unemployment rate rises 0.5 percentage points above its 12-month low.) |
| 2. Average Prime Rate | The rate banks charge their most creditworthy customers, which tends to follow interest rate moves by the Fed. | A drop in the prime rate, which typically only occurs after the Fed has been forced to cut its benchmark rate to stimulate an already weak economy. |
| 3. Consumer Price Index (CPI) for Services | Measures inflation in the services sector. Prices for services (like rent or medical care) tend to be “sticky” and decline only after an economic slowdown is well underway. | A decline in the rate of service-sector inflation. |
The key takeaway is that economists rarely rely on just one signal. They look for confluence, meaning multiple leading indicators must flash red at the same time to suggest a high probability of a recession.